– Platform · Site Analysis
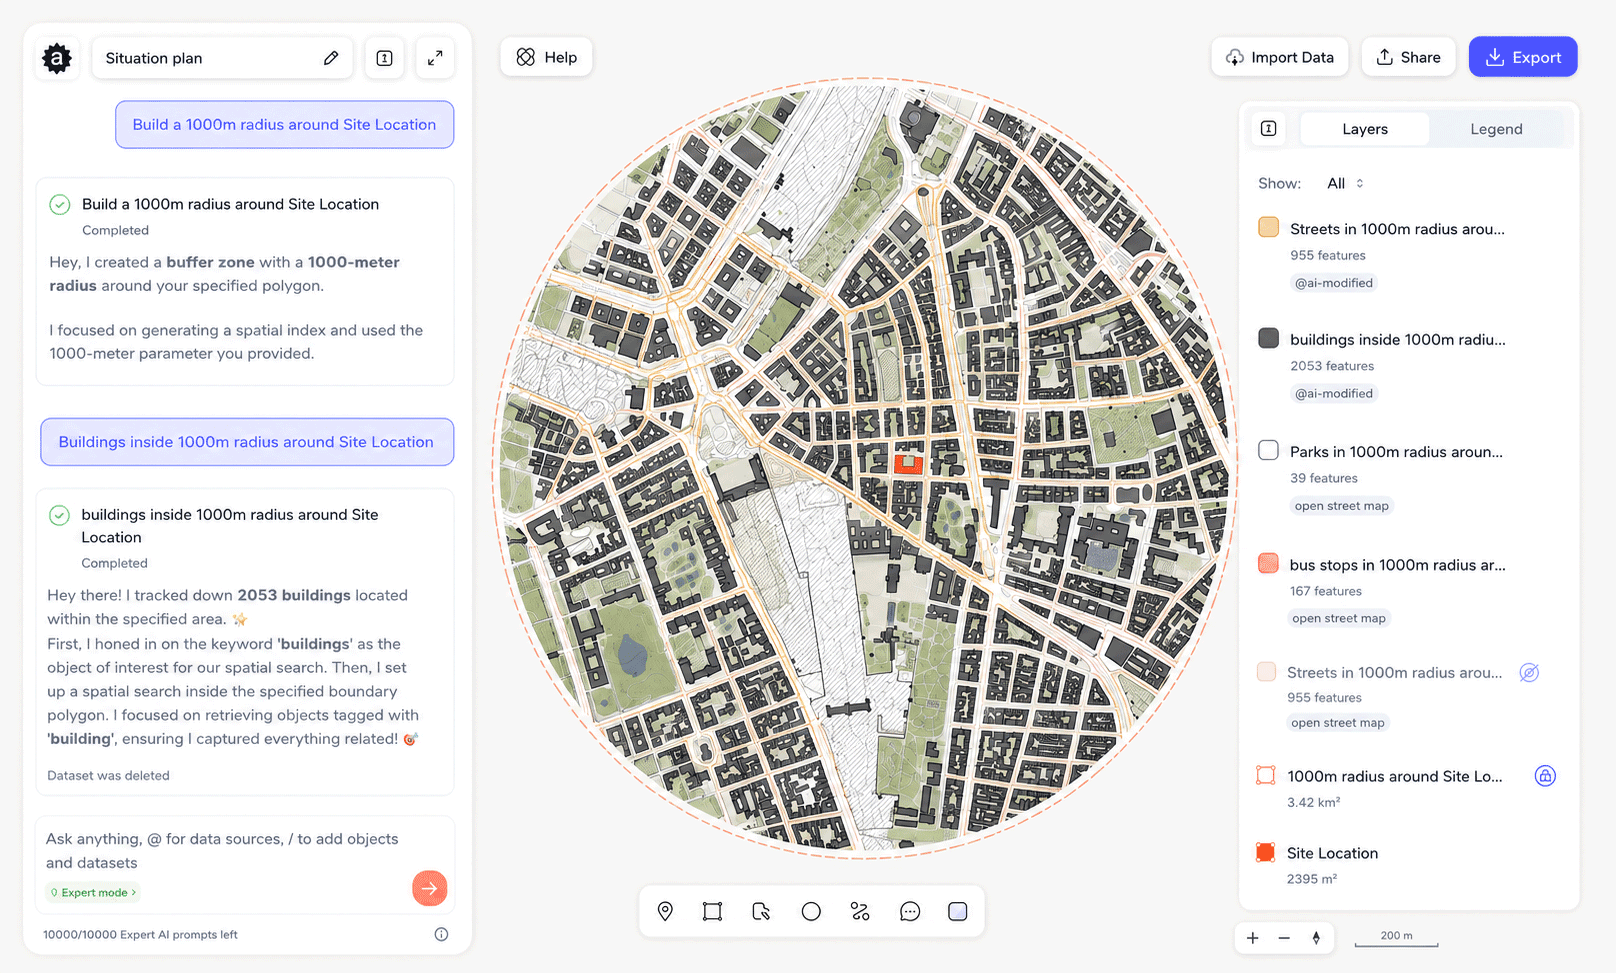
Aino is a site analysis AI platform for architects, planners and development teams. Drop an address, connect 10+ verified data sources, and get zoning, mobility, demographics, environmental risk and feasibility findings in under 15 minutes — without GIS software.
15 min
Single site to full report
400+
Cities covered
01
Every layer of context, automatically integrated
02
Analysis structured around your project type
Whether it's a masterplan, site feasibility, mixed-use development or planning submission — Aino structures findings around the decisions you actually need to make.
— Templates for residential, mixed-use, civic and infrastructure projects
— Insight summaries ready for client communications
— Constraints, opportunities and risks surfaced automatically
03
Human-level findings, fully source-tracked
Every result is sourced from verified datasets — Google Maps, Overture Maps, ESA Copernicus, municipal open data — not scraped or estimated. Every finding carries source attribution, dataset version and methodology so you can answer where the numbers come from.
— Sourced from Google Maps, Overture Maps, ESA Copernicus, municipal datasets
— Per-finding source attribution
— Versioned datasets and full export audit trail
— Methodology documentation auto-attached
04
One site or a full portfolio — same workflow
Run a single site analysis or upload a list of locations. Aino processes all of them in parallel — same methodology, same data standard, results ready to compare side by side.
—Single address or bulk portfolio upload
—Parallel processing across all locations
—Consistent methodology across every site
—Lives in your workspace, accessible to the whole team
What data does Aino analyse
01
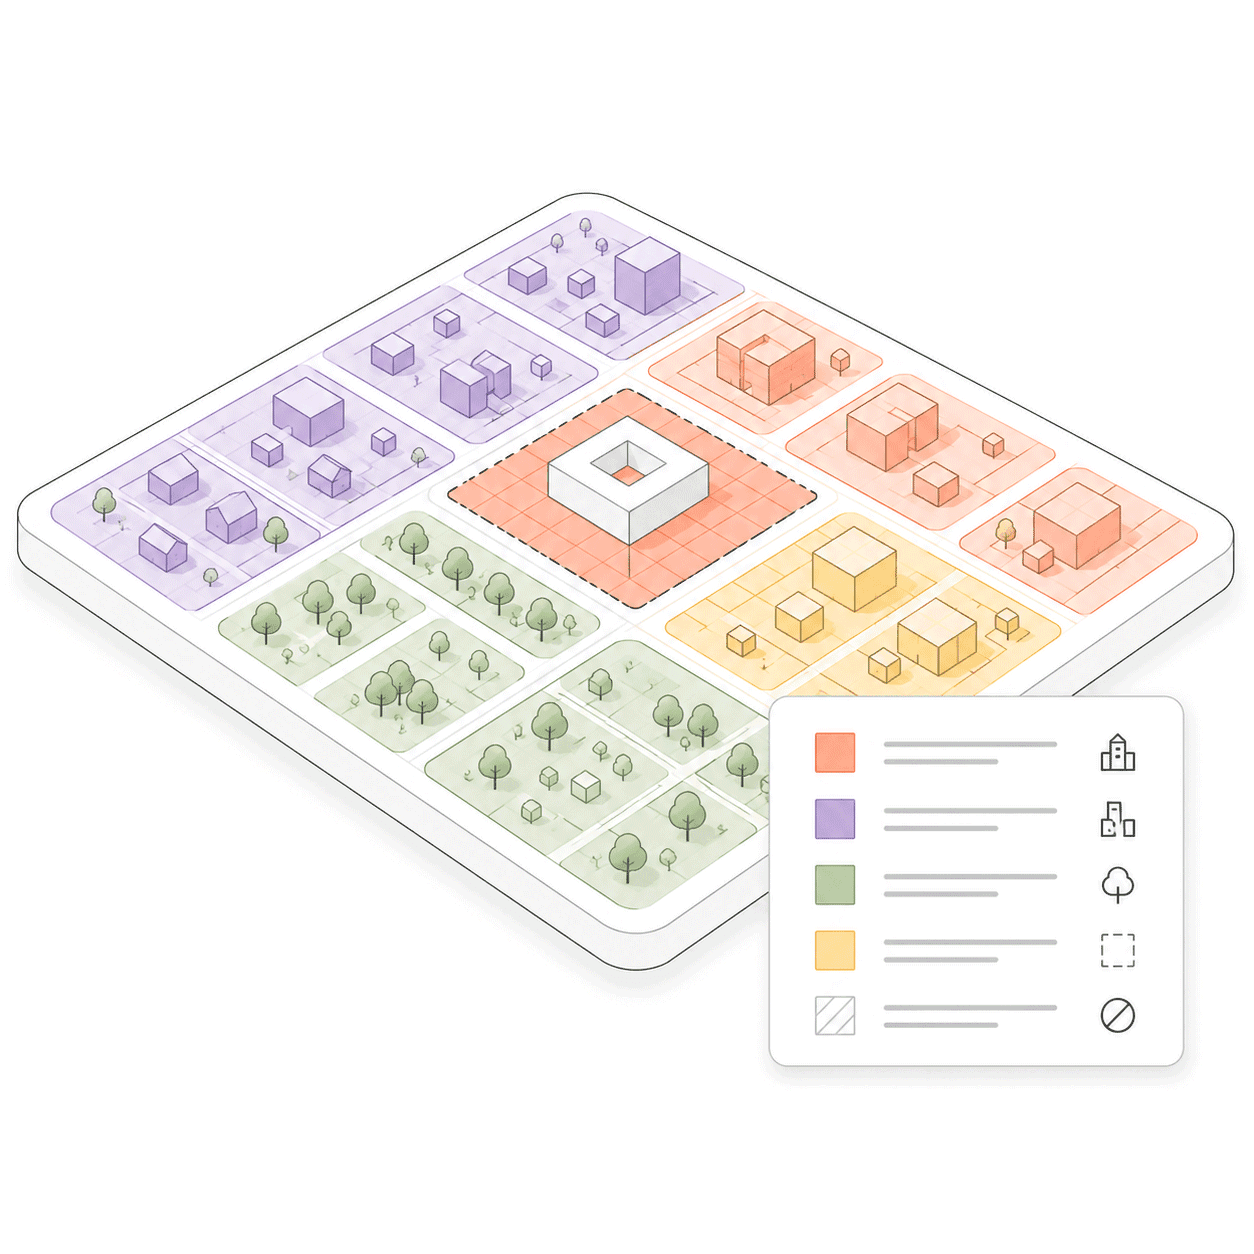
Zoning & land use
Classification, permitted uses, overlay restrictions, setback requirements. Sourced from municipal and government datasets.
02
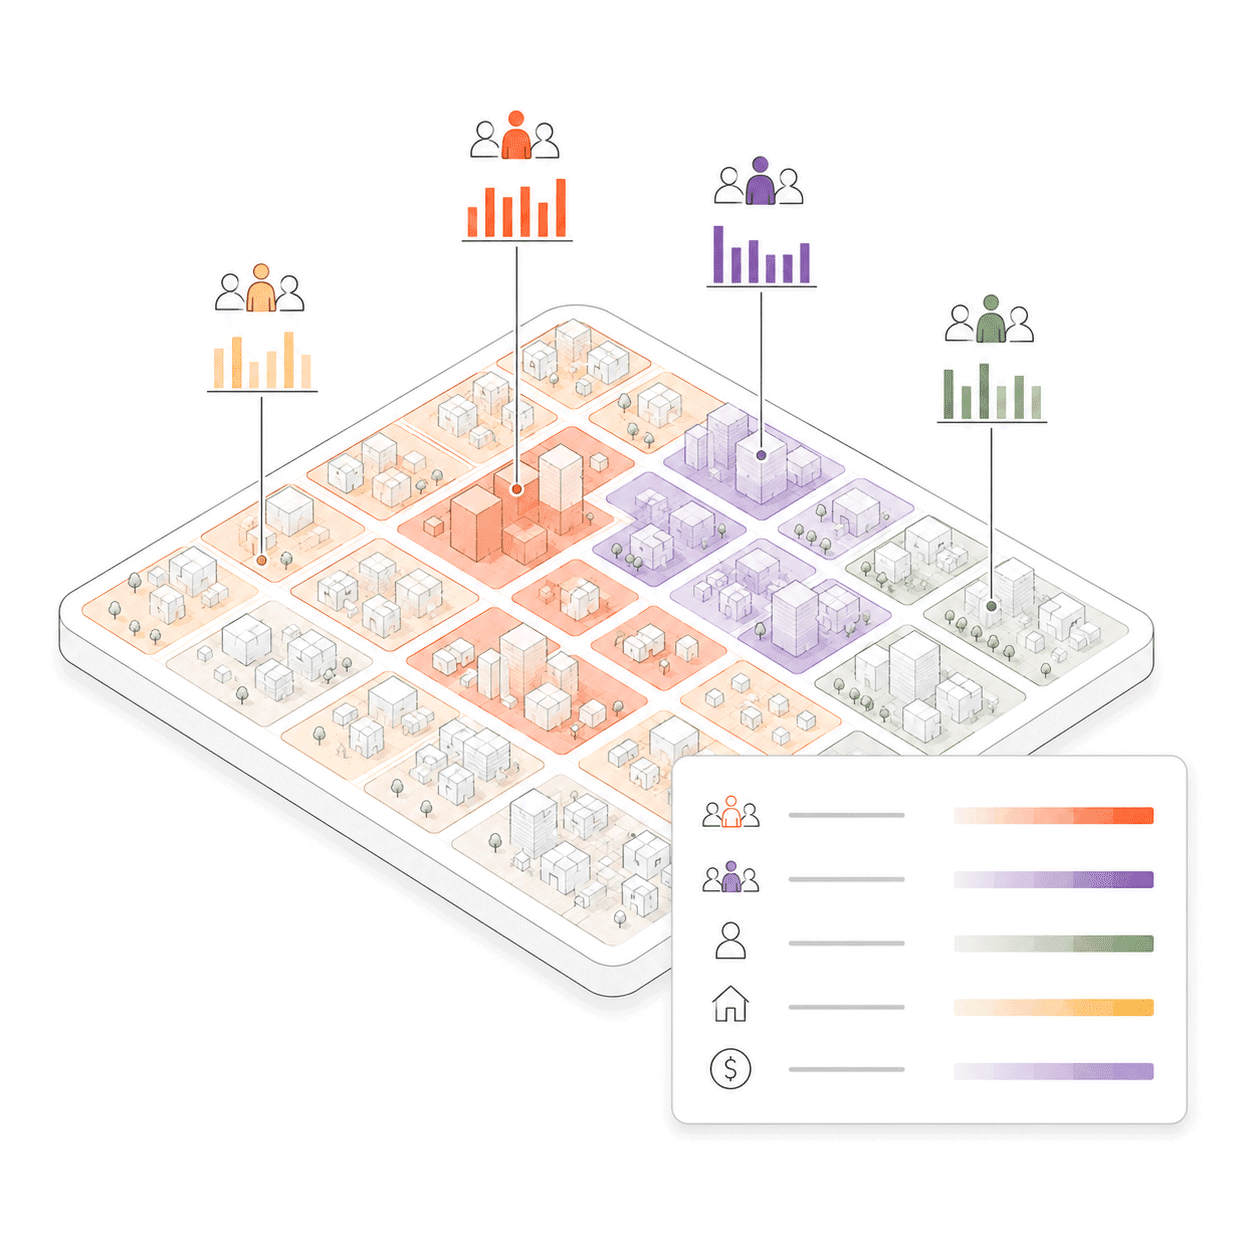
Demographics & population
Population density, age structure, household composition, income distribution. Down to neighbourhood level.
03
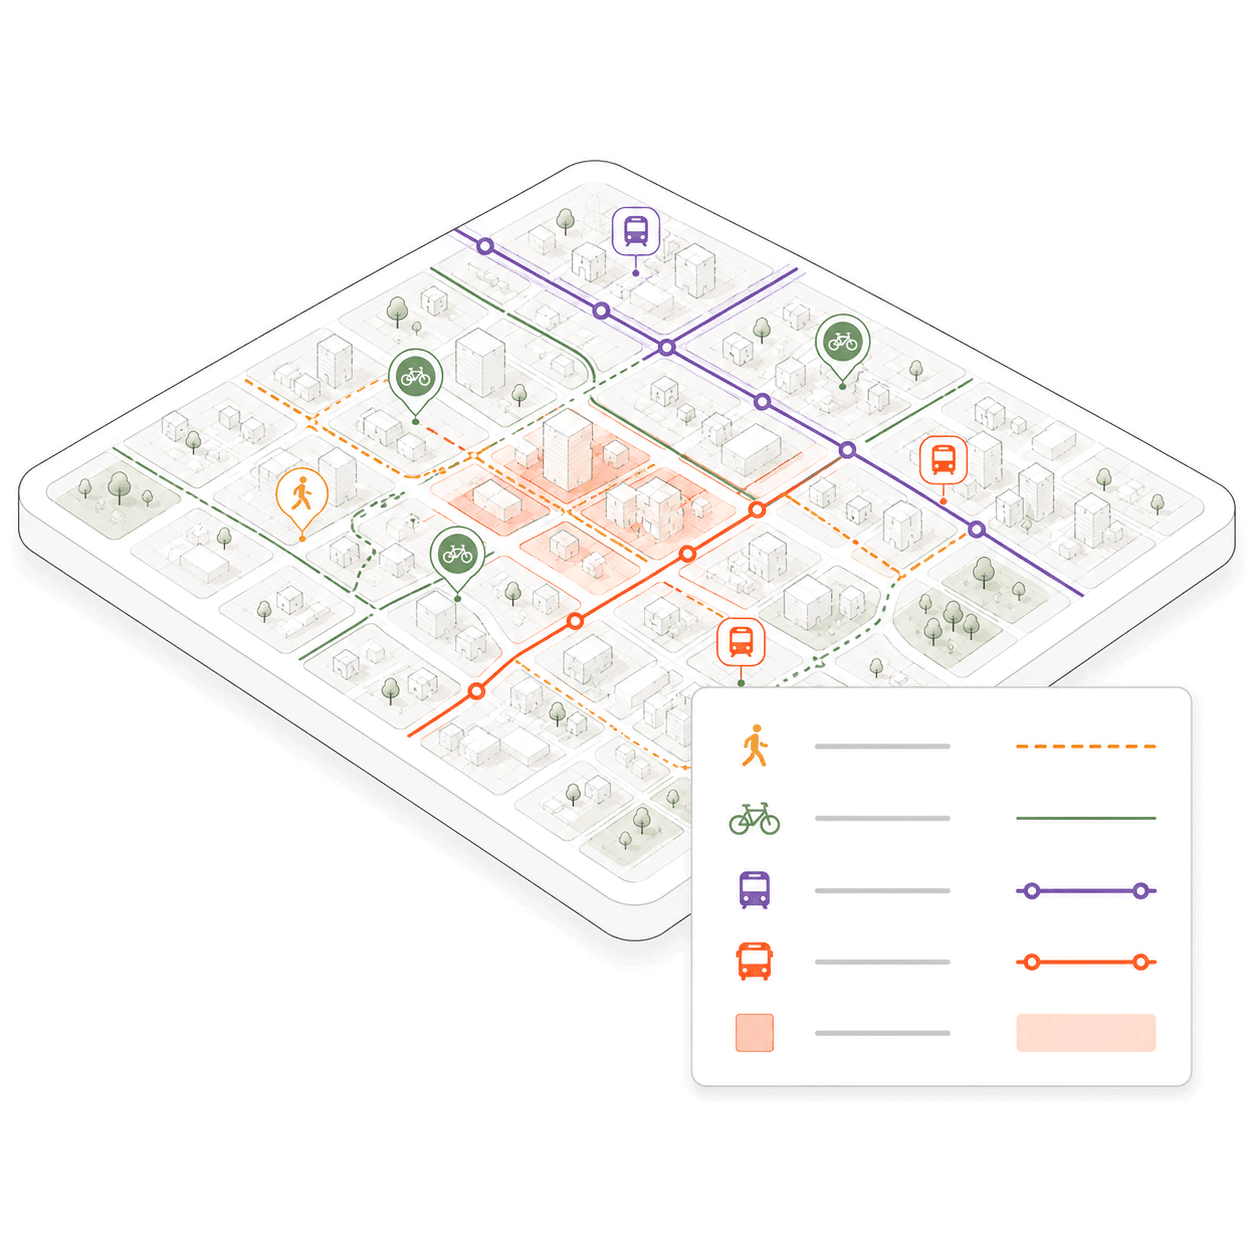
Mobility & accessibility
Walking, cycling and transit access. Street network connectivity, public transport stops, pedestrian flow.
04
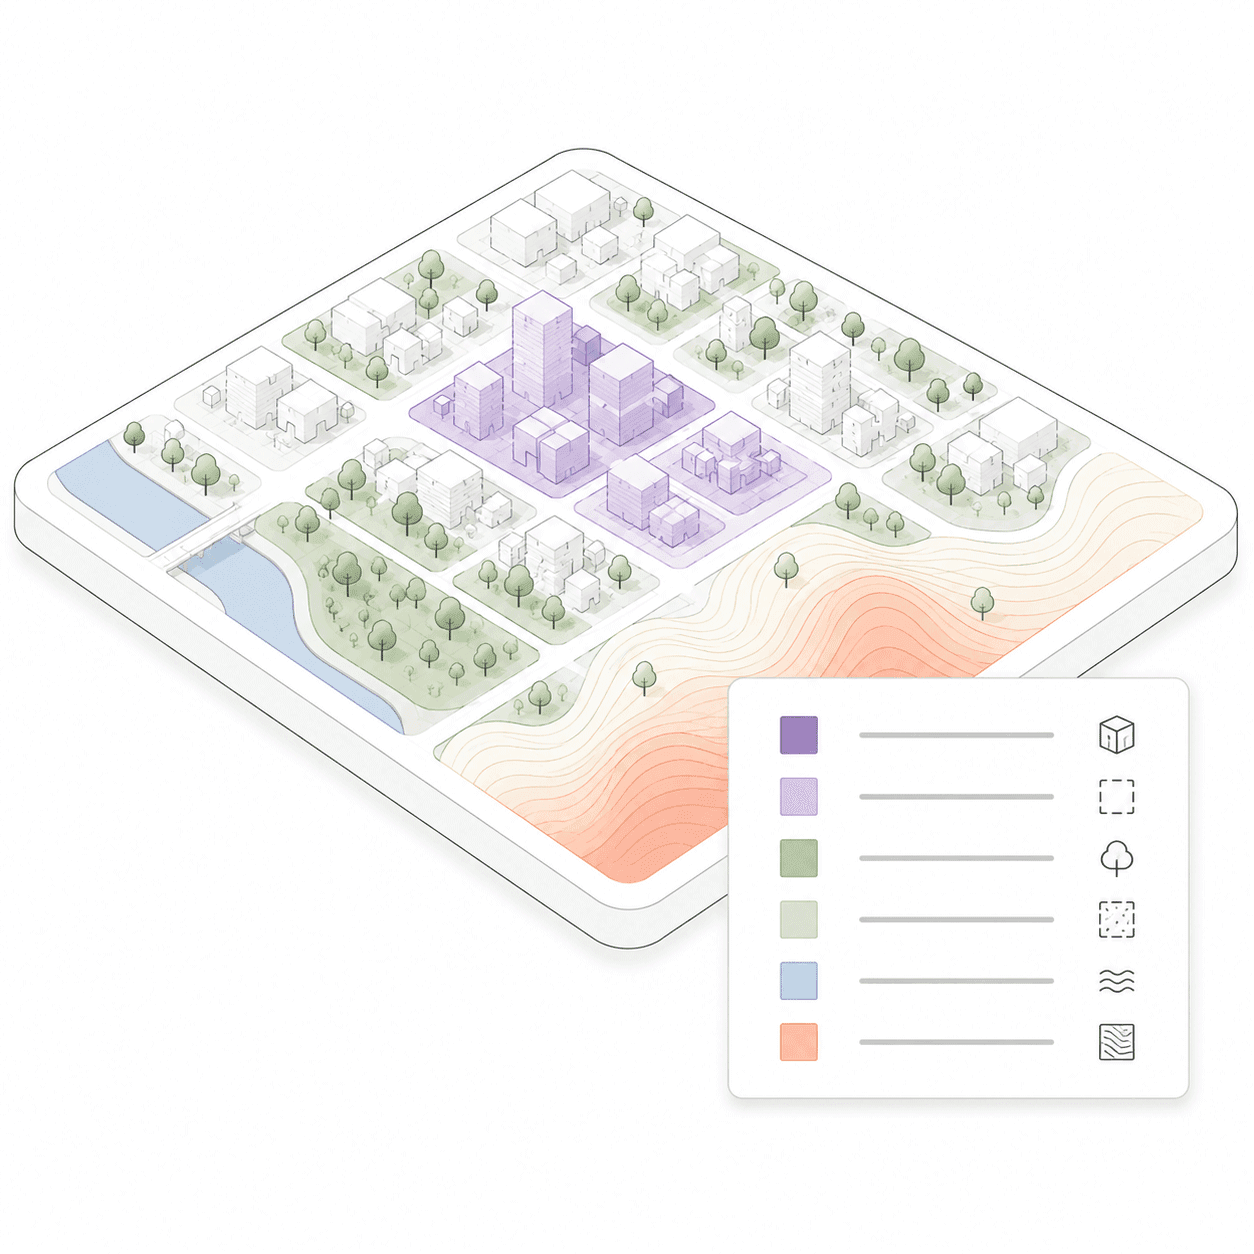
Built environment
Building footprints, heights, land cover, green areas, terrain and elevation.
04
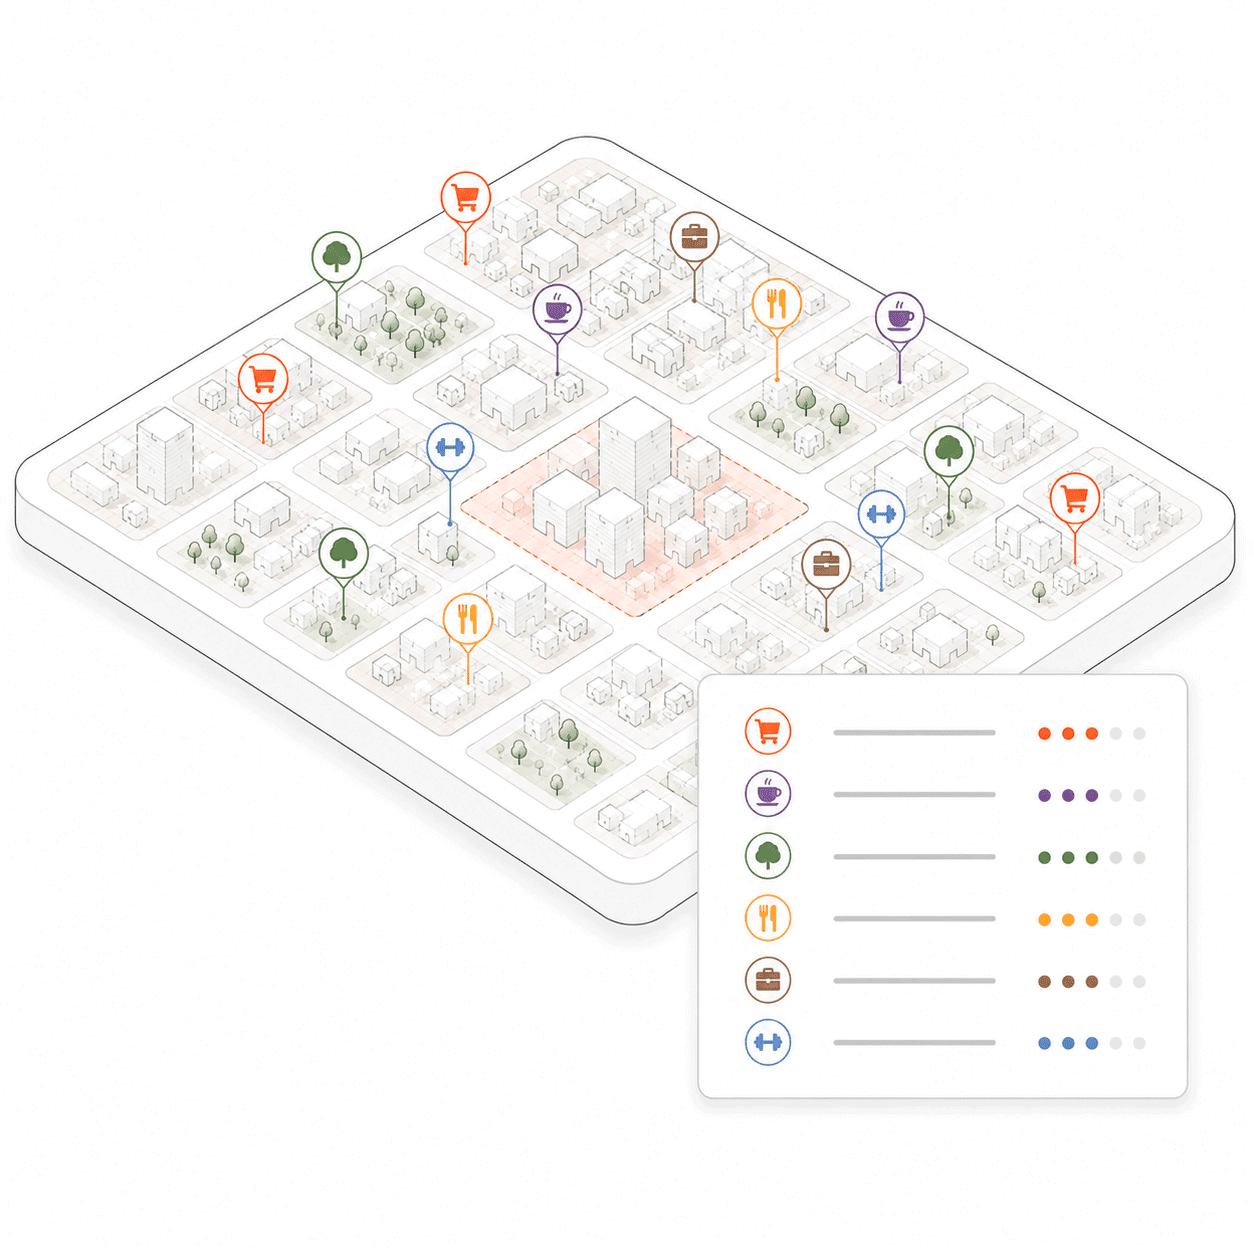
Points of interest & competition
Amenities, retail, services, competitors. Understand what's already there before you design around it.
04
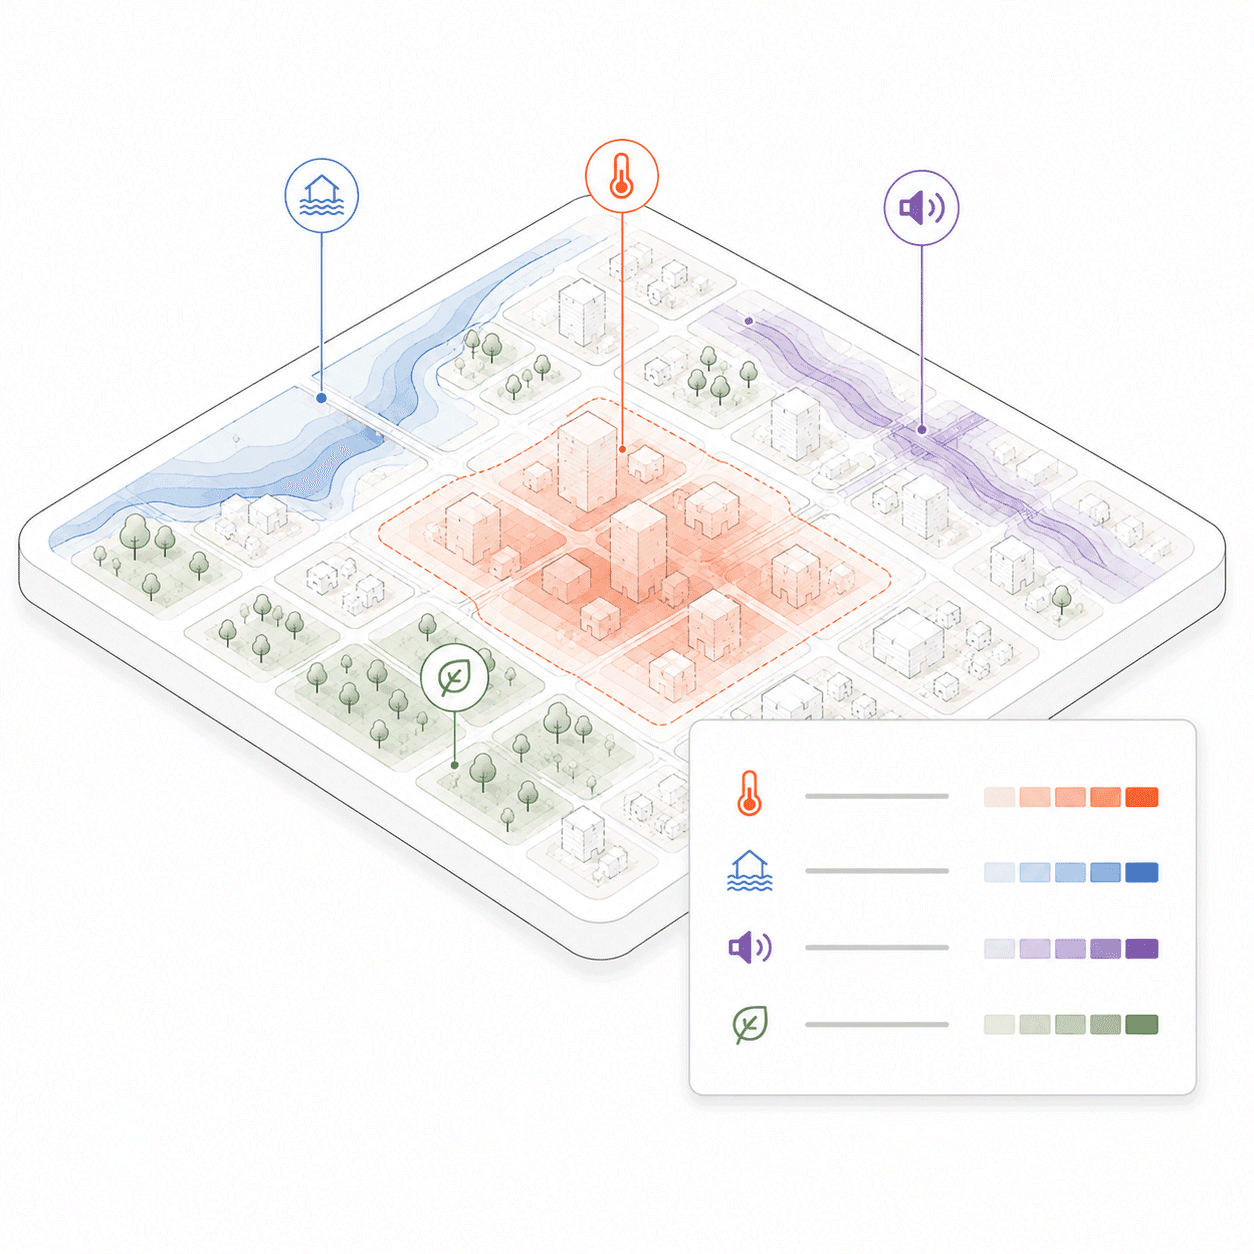
Environmental context
Climate data, flood risk, noise levels, land cover.
How it works
STEP 01
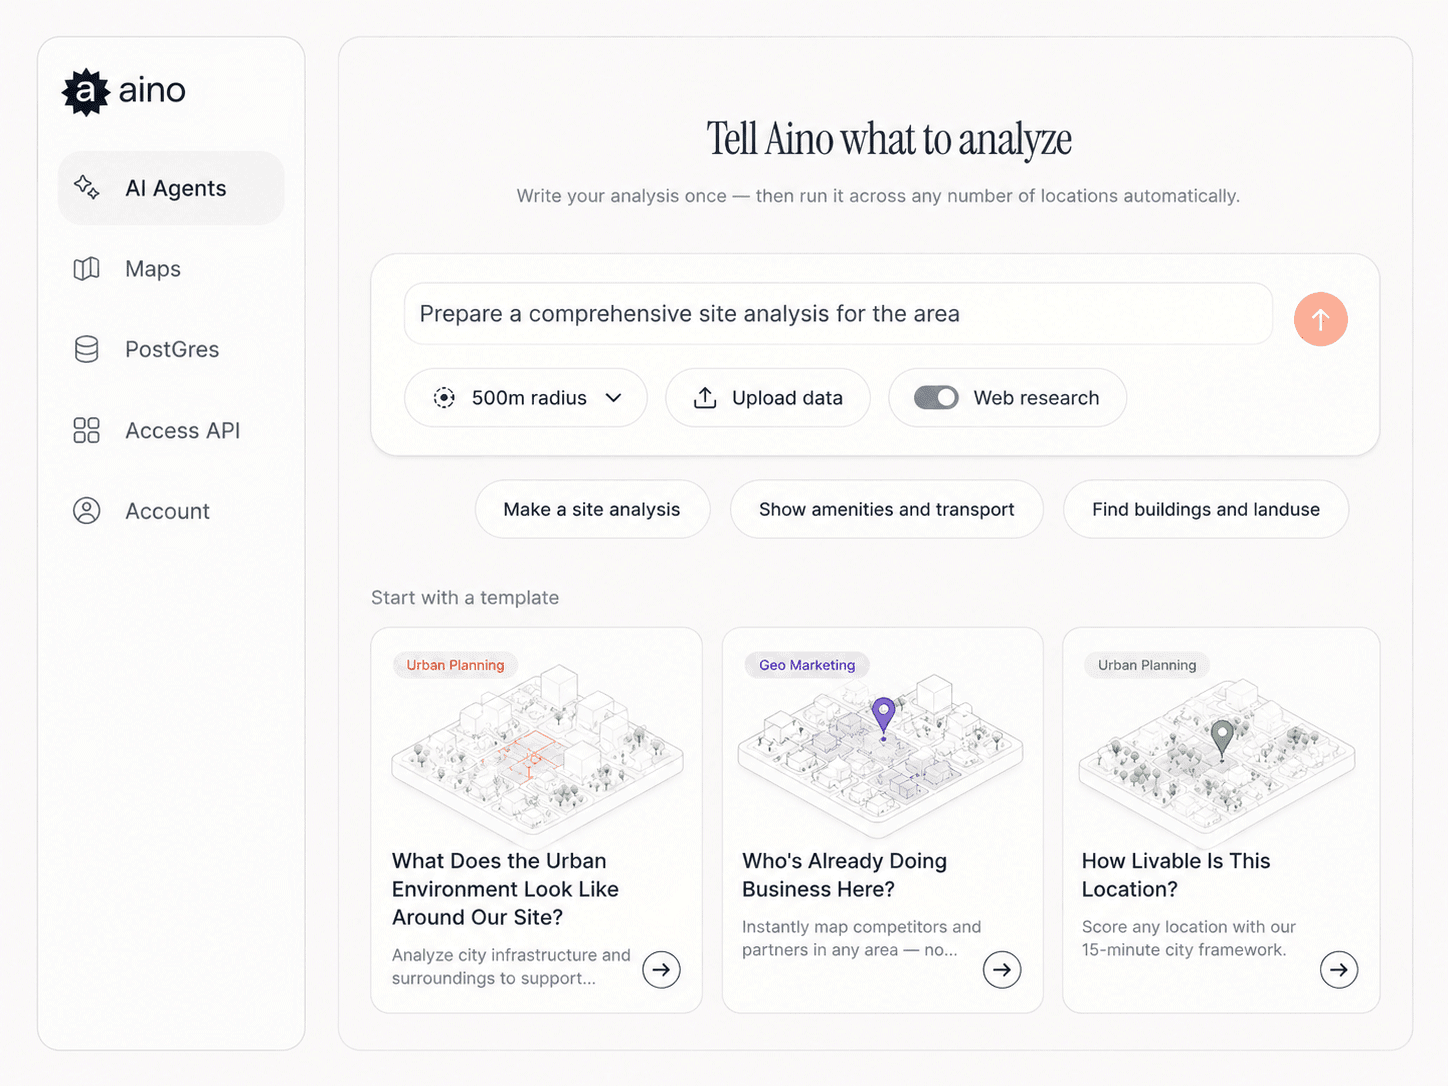
Define your analysis
Describe what you need in plain language — or use a template your studio has run before. Aino prepares the analysis structure and connects the relevant data sources for your project type.
STEP 02
Run the analysis, get the data
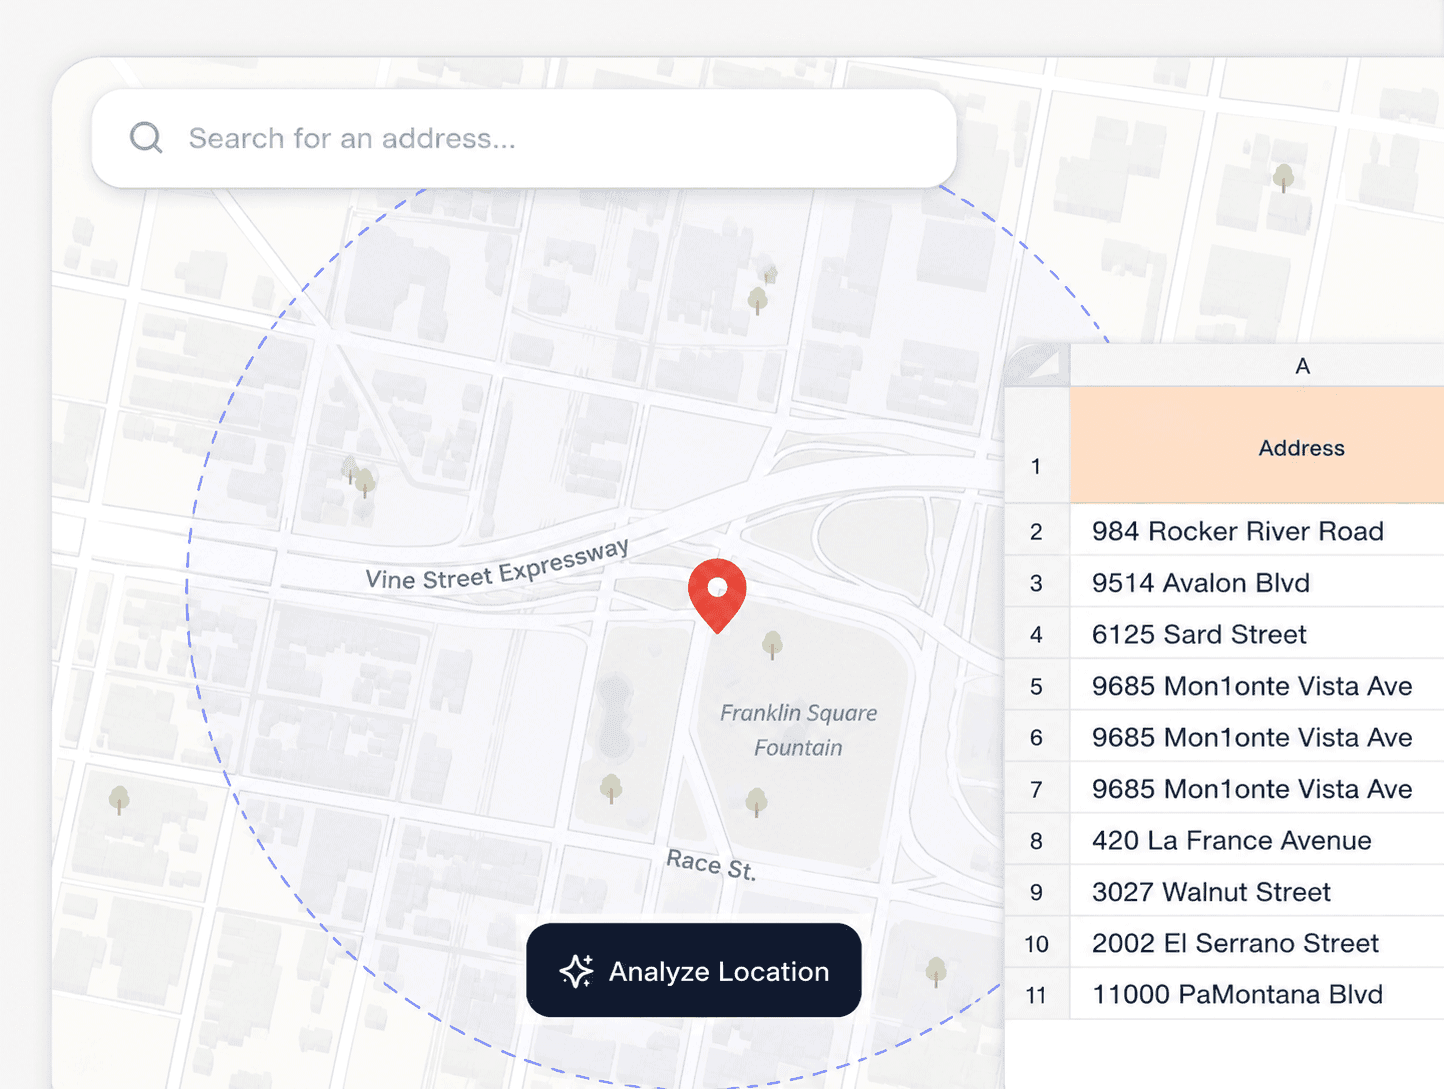
Enter an address, drop a pin, or upload a list. Aino processes all connected data sources and returns structured findings — scored, ranked and ready to interpret. Every figure sourced and traceable.
STEP 03
Design the map, share or export
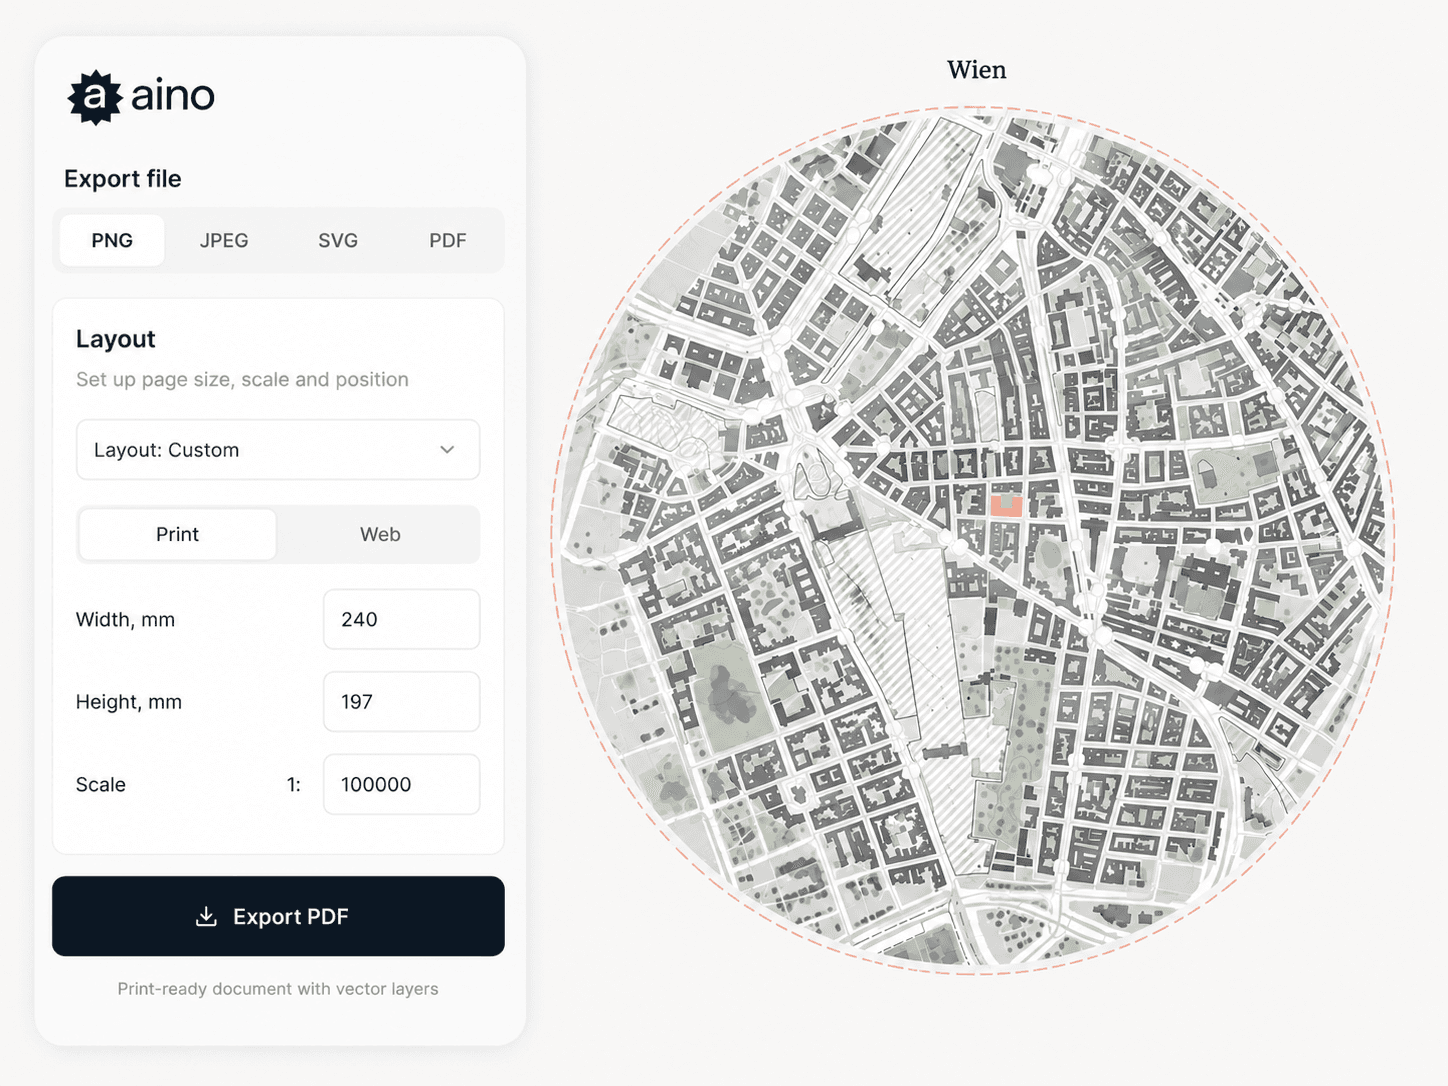
Turn your findings into a presentation-ready map — styled, labelled, ready for your slide deck or planning submission. Export as PDF, PNG, DXF or GeoJSON, or share a live link directly with your client or planning team.
Client-ready output
Development teams
Location due diligence as part of the project process. Sourced, documented, defensible.
Architects & urban planners
Site context before the first sketch. Zoning, mobility, density — ready before the kickoff meeting.
Land acquisition consultants
Consistent methodology across every commission. Same data standard, every city, every team member.
Part of a bigger workflow
Site Selection finds your top candidates. Deep Site Analysis gives you everything
you need to make the final call — full spatial report, feasibility context, presentation-ready output.